

Teenva AI and Digital Ventures delivers DevOps and monitoring services from Bangalore, India, so you find out when production breaks before your customers do. We set up CloudWatch metrics and alarms, structured logging, uptime checks, backup verification, and incident runbooks for travel portals, SaaS applications, and ecommerce platforms running on AWS.
Monitoring only matters if someone acts on it. We build actionable alerts, clear on-call paths, and correlation with CI/CD deploys and integration health — backed by managed IT support when an incident needs a code fix, not just a notification.
Get Support for Your Existing Website
CloudWatch, alerts, logging, backups, and incident response for production web and travel platforms.
What We Monitor
| Layer | Signals |
|---|---|
| Infrastructure | EC2 CPU, memory, and disk; RDS connections and storage; ElastiCache hit rate |
| Application | HTTP 5xx rate, p95 latency, queue depth (SQS/Redis) |
| Synthetic uptime | External ping checks plus critical-path checks (homepage, login, search) |
| Logs | Structured JSON errors, Laravel log channels, slow-query flags |
| Integrations | Payment webhook failure counts, WhatsApp API delivery errors |
| Business (scoped) | Booking error rate, failed GDS calls — travel API dashboards |
| Backups | RDS snapshot age, S3 lifecycle compliance |
| SSL & DNS | Certificate expiry, Route 53 health checks |
| Deploys | Marker events from CI/CD, correlated against metrics |
Monitoring Stack (Typical on AWS)
| Tool | Role |
|---|---|
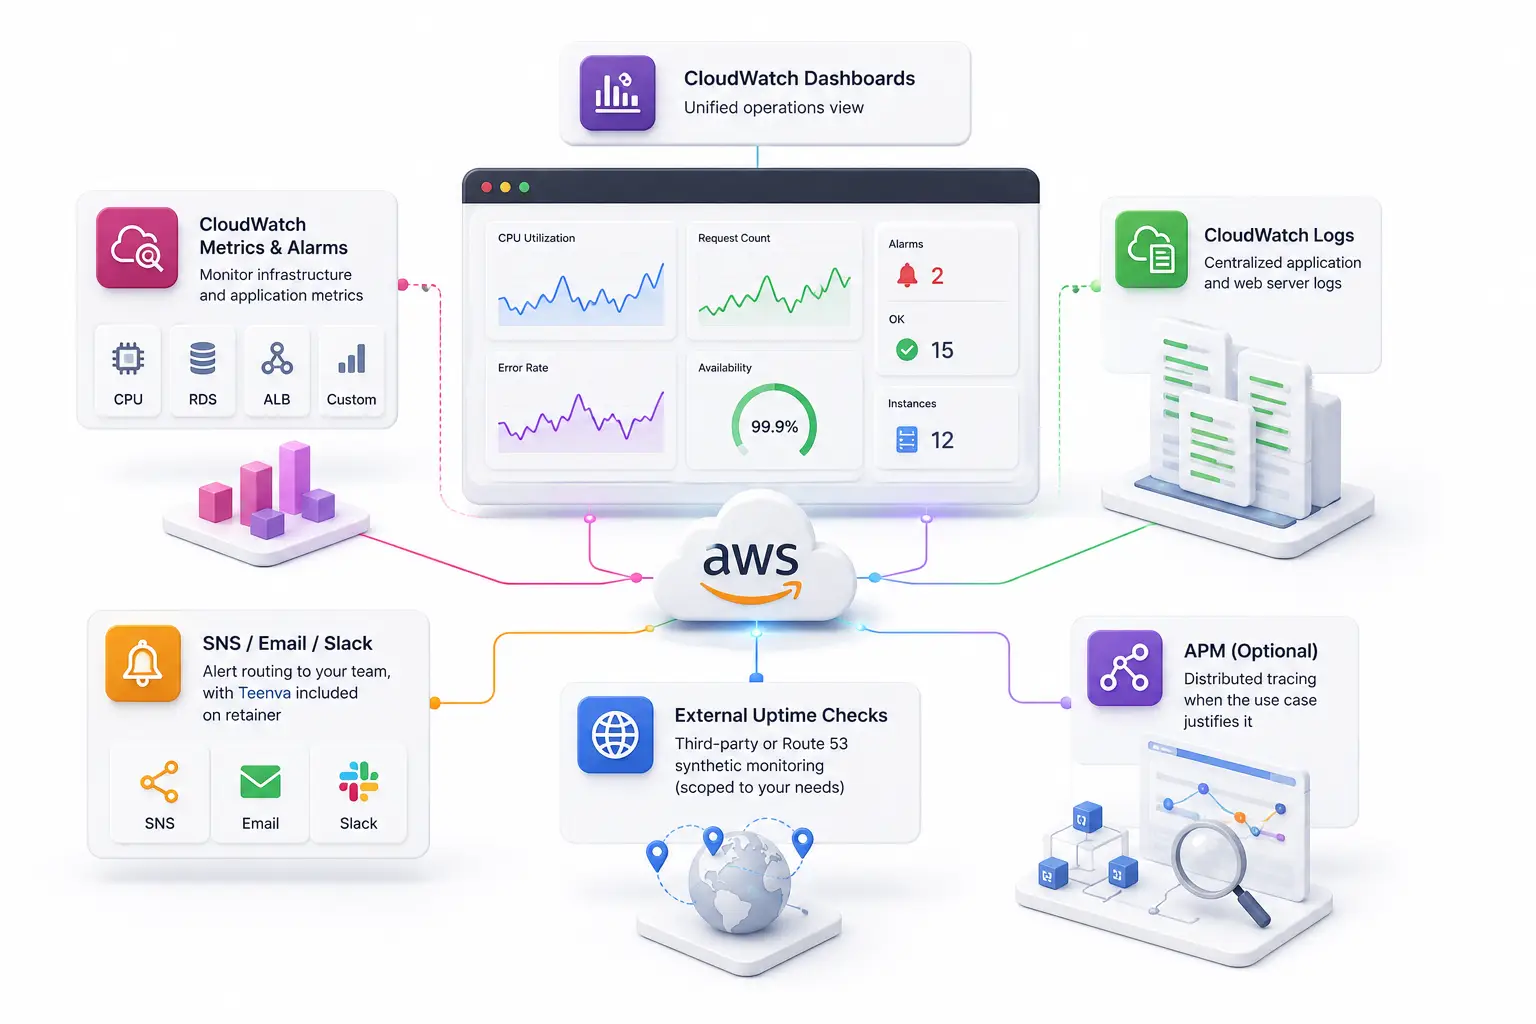
| CloudWatch Metrics & Alarms | CPU, RDS, ALB, and custom application metrics |
| CloudWatch Logs | Centralized application and web server logs |
| CloudWatch Dashboards | A single operations view combining infrastructure and application KPIs |
| SNS / Email / Slack | Alert routing to your team, with Teenva included on retainer |
| External uptime checks | Third-party or Route 53 synthetic monitoring (scoped to your needs) |
| APM (optional) | Distributed tracing when the use case justifies it — generic tooling, no vendor lock-in |
We start with a lean, useful setup — not 200 alarms nobody has tuned.
Alert Design Principles
| Principle | Why It Matters |
|---|---|
| Actionable only | Alert when someone needs to act, not on every minor CPU blip |
| Severity tiers | P0 pages the on-call engineer; P2 goes to an email digest |
| Runbook linked | Every alarm documents what to check, what to run, and when to escalate |
| Alert fatigue avoided | Thresholds are tuned and composite alarms used where it helps |
| Deploy-aware | Alerts are suppressed during known CI/CD deploy windows to cut noise |
| Tested regularly | A quarterly fire drill confirms alarms actually notify the right people |
If your customers are finding out about downtime on social media before you do, uptime checks and ALB 5xx alarms catch it first — then our managed IT support fixes the root cause.
Logging Best Practices We Implement
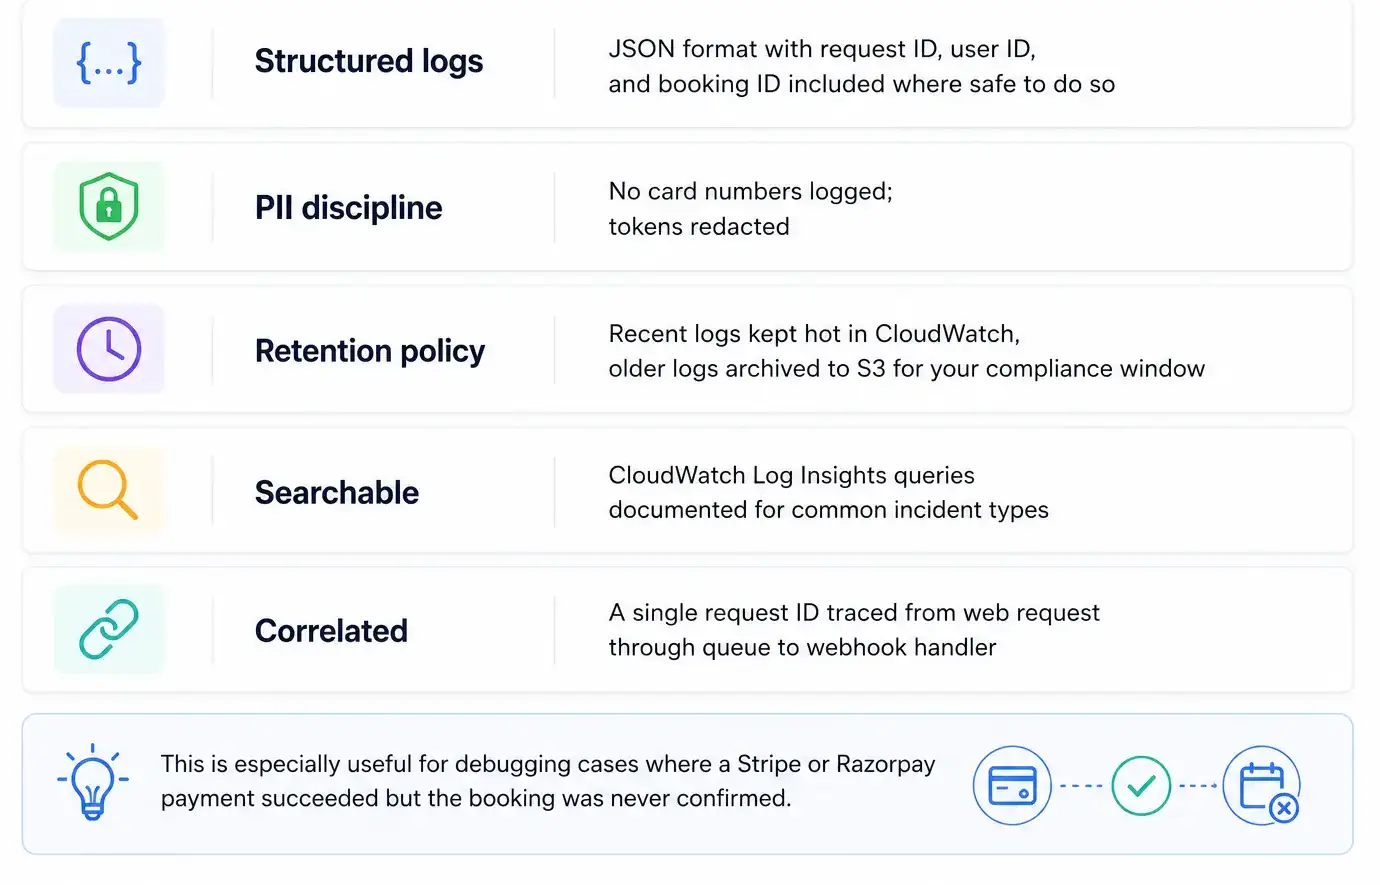
- Structured logs — JSON format with request ID, user ID, and booking ID included where safe to do so
- PII discipline — no card numbers logged; tokens redacted
- Retention policy — recent logs kept hot in CloudWatch, older logs archived to S3 for your compliance window
- Searchable — CloudWatch Log Insights queries documented for common incident types
- Correlated — a single request ID traced from web request through queue to webhook handler
This is especially useful for debugging cases where a Stripe or Razorpay payment succeeded but the booking was never confirmed.
Incident Response
| Phase | Teenva's Role |
|---|---|
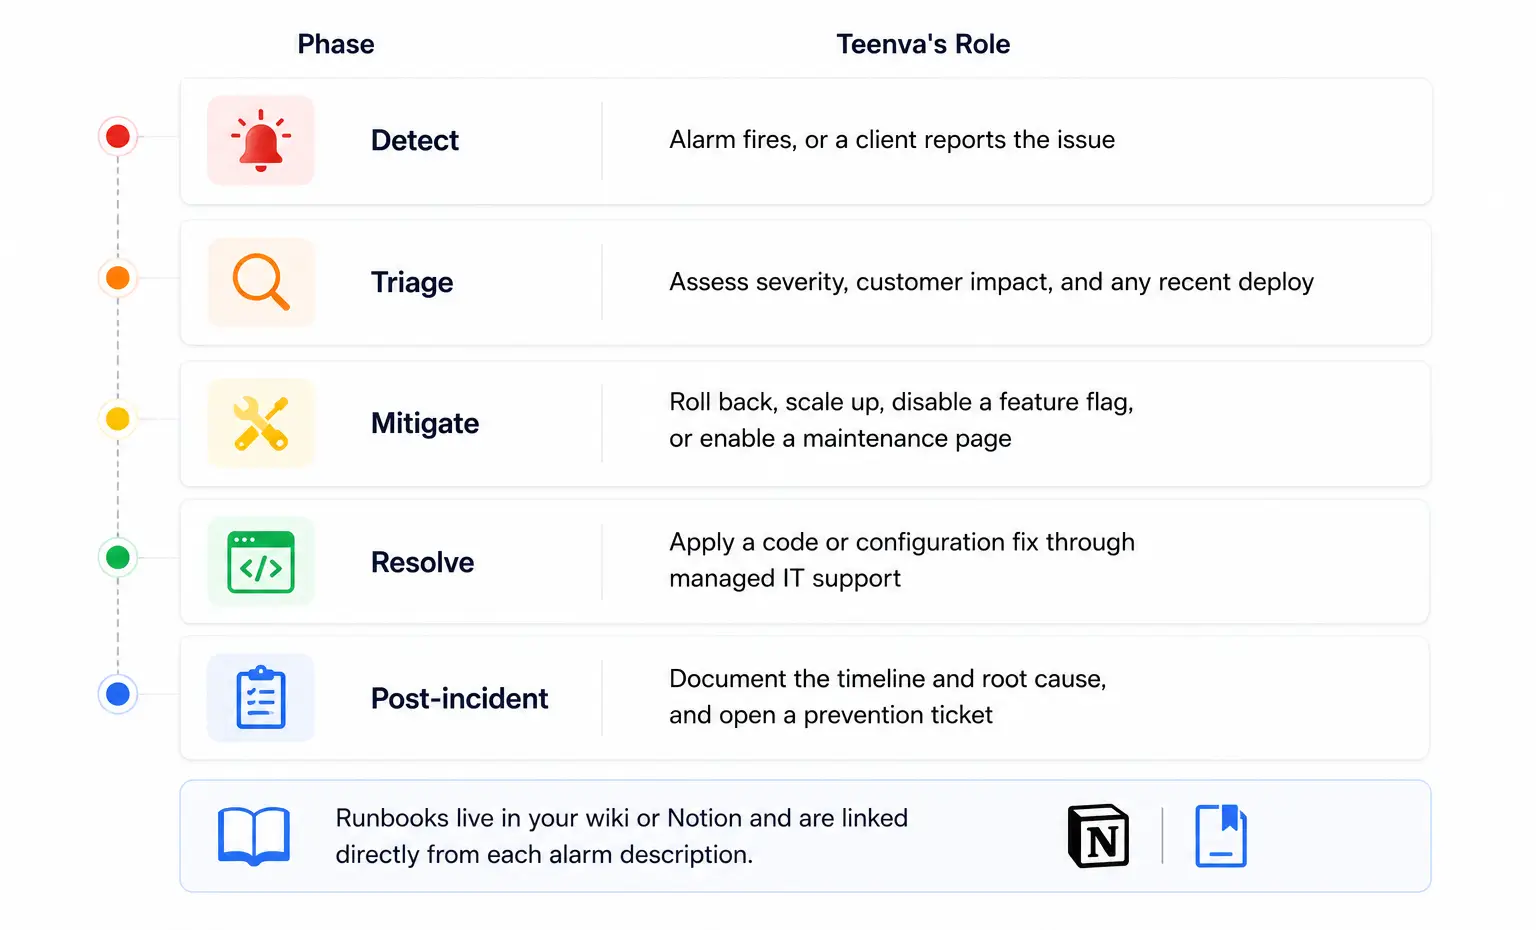
| Detect | Alarm fires, or a client reports the issue |
| Triage | Assess severity, customer impact, and any recent deploy |
| Mitigate | Roll back, scale up, disable a feature flag, or enable a maintenance page |
| Resolve | Apply a code or configuration fix through managed IT support |
| Post-incident | Document the timeline and root cause, and open a prevention ticket |
Runbooks live in your wiki or Notion and are linked directly from each alarm description.
Who Needs DevOps Monitoring
| Persona | Without Monitoring | With Monitoring |
|---|---|---|
| Travel OTA | Bookings fail silently during peak periods | GDS error spikes trigger an immediate alert |
| SaaS | Database slows down until it crashes | RDS connection alarm catches it early |
| Ecommerce | Checkout 500 errors go unnoticed | ALB 5xx and payment webhook monitoring flag it |
| Small team | The founder ends up on-call by accident | A defined escalation path routes to Teenva |
| Post-migration | A new AWS environment is unproven | Baseline dashboards are in place from day one |
Who Needs DevOps Monitoring
- Travel OTAs
- SaaS products
- Ecommerce stores
- Small engineering teams
- Post-AWS migration projects
- Integration-heavy applications
Why Teenva AI for Monitoring
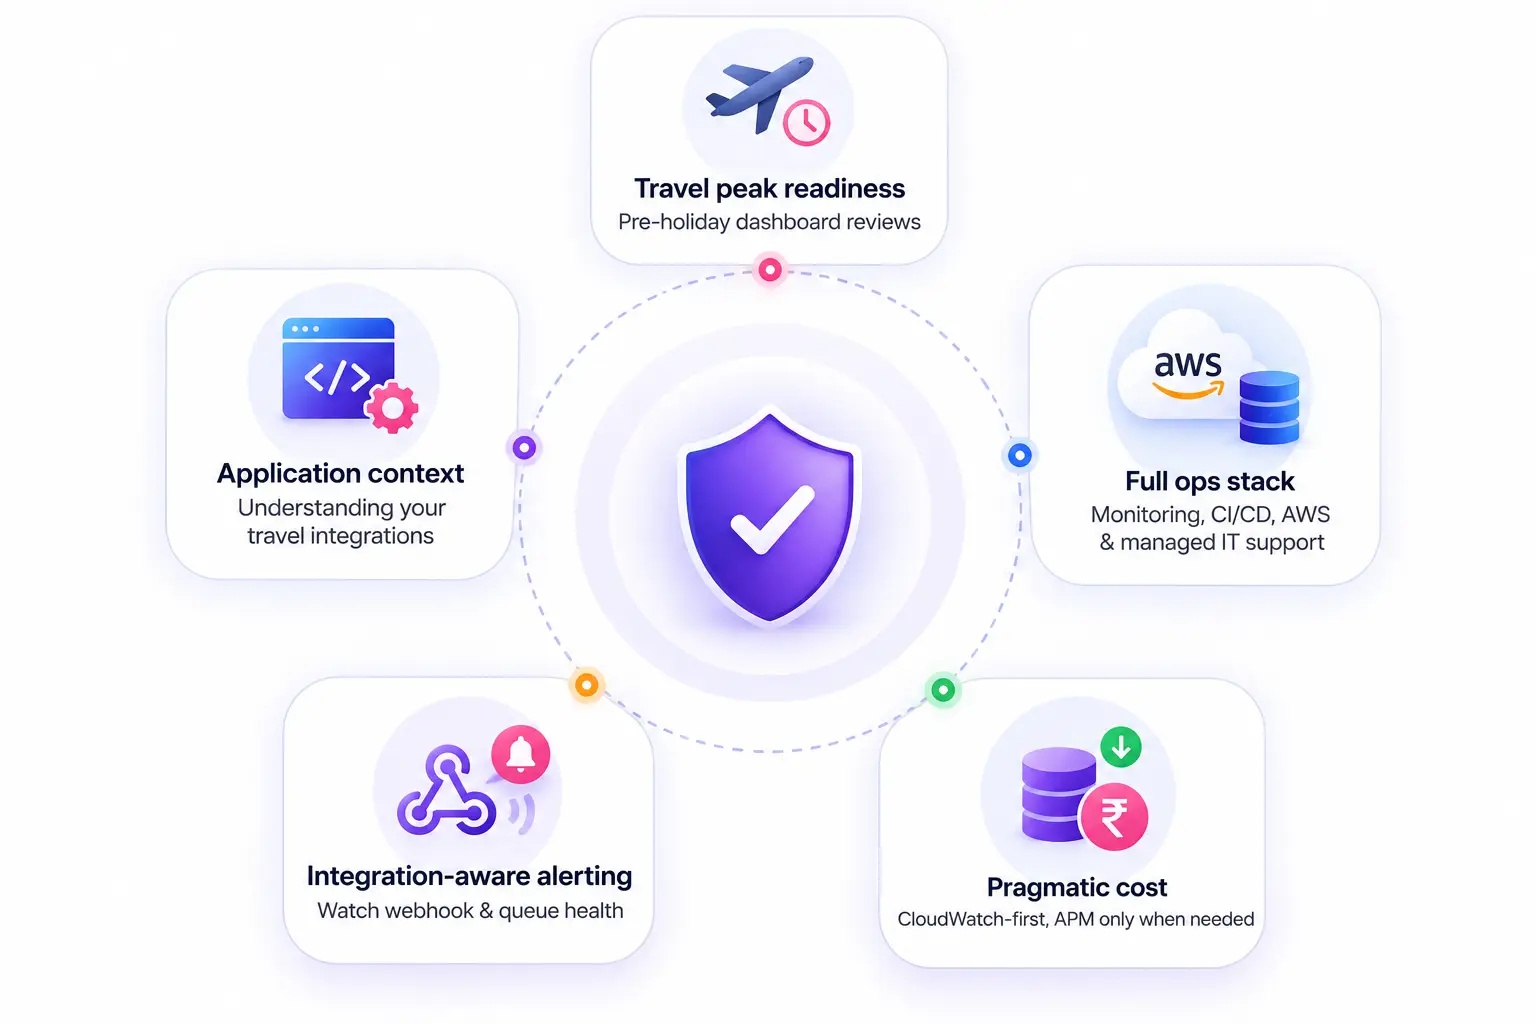
Application context
We understand which queue handles your channel manager sync jobs, not just generic server metricsTravel peak readiness
Pre-holiday dashboard reviews are included as part of a scoped retainerFull ops stack
Integration-aware alerting
We watch webhook dead-letter queue depth, not just CPU usagePragmatic cost
CloudWatch-first approach; we bring in expensive APM tooling only when the case for it is clear
Travel Platform Monitoring
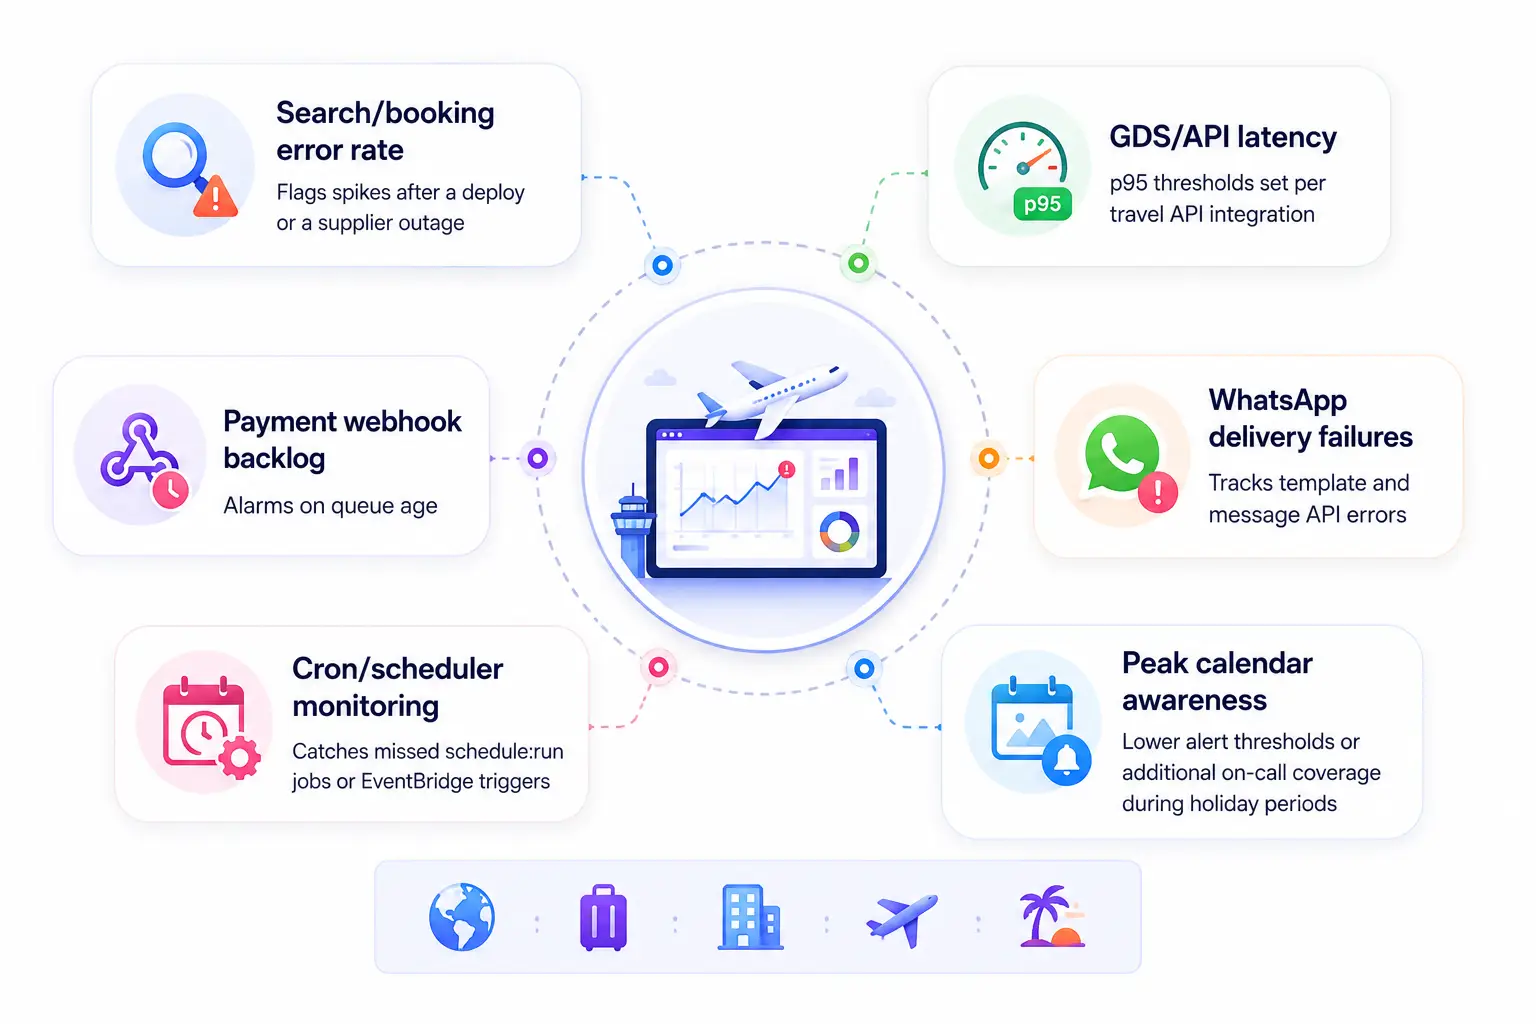
Travel platforms need more than generic uptime checks:
- Search/booking error rate — flags spikes after a deploy or a supplier outage
- GDS/API latency — p95 thresholds set per travel API integration
- Payment webhook backlog — alarms on queue age
- WhatsApp delivery failures — tracks template and message API errors
- Cron/scheduler monitoring — catches missed schedule:run jobs or EventBridge triggers
- Peak calendar awareness — lower alert thresholds or additional on-call coverage during holiday periods
Our Monitoring Implementation Process
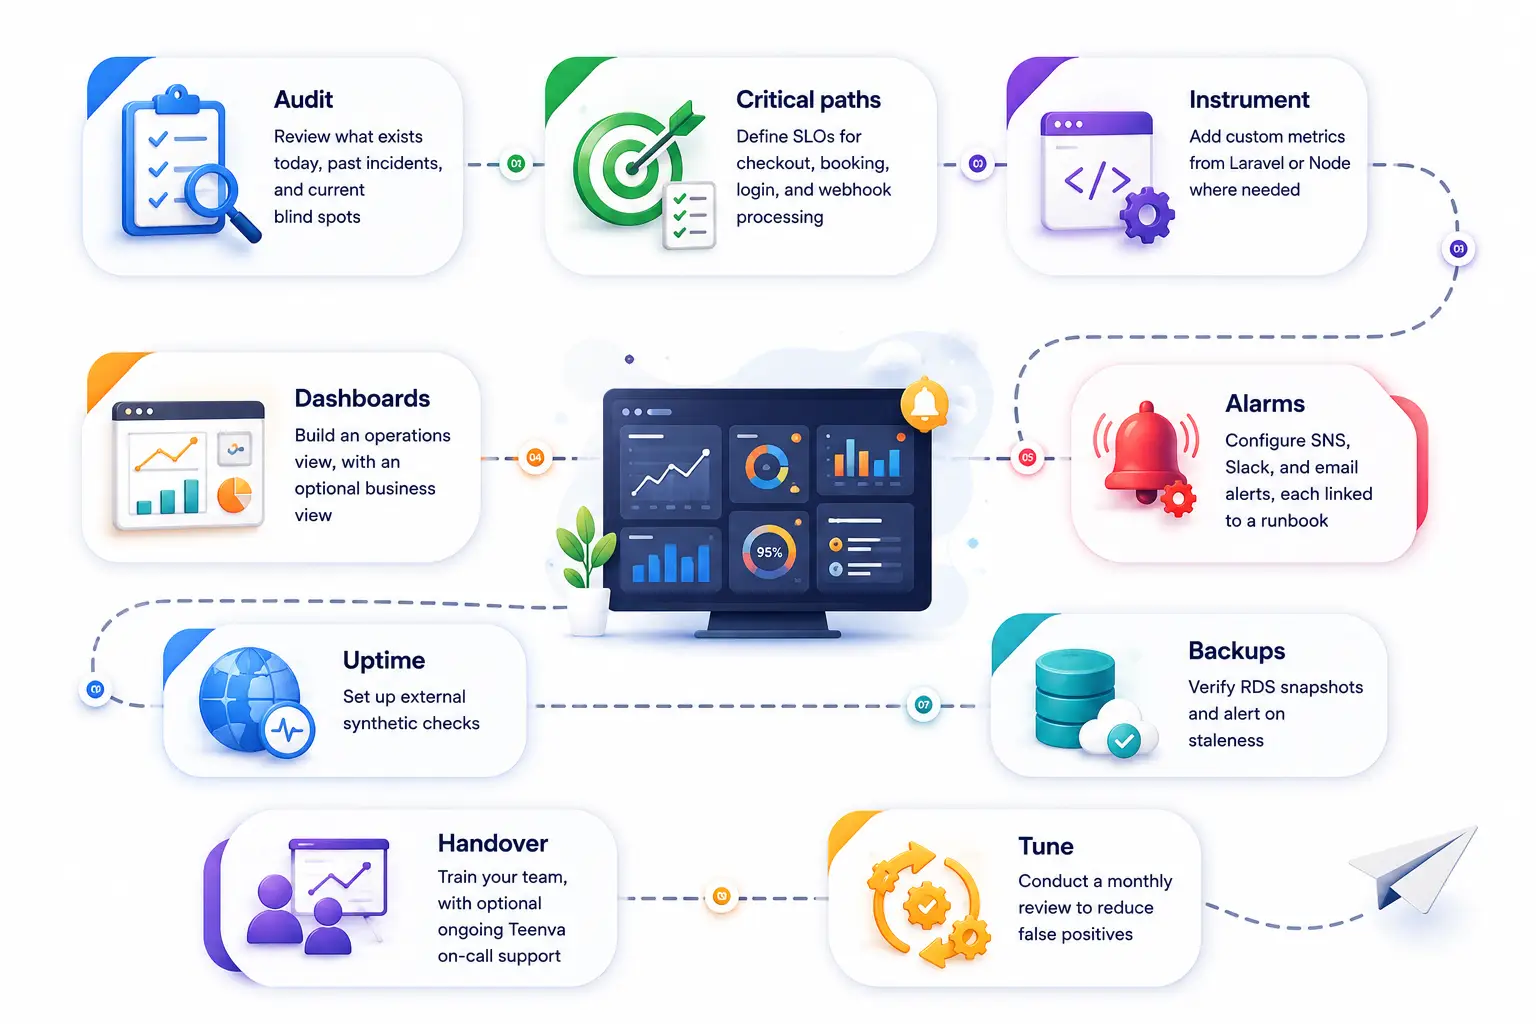
Audit
Review what exists today, past incidents, and current blind spots
Critical paths
Define SLOs for checkout, booking, login, and webhook processing
Instrument
Add custom metrics from Laravel or Node where needed
Dashboards
Build an operations view, with an optional business view
Alarms
Configure SNS, Slack, and email alerts, each linked to a runbook
Uptime
Set up external synthetic checks
Backups
Verify RDS snapshots and alert on staleness
Handover
Train your team, with optional ongoing Teenva on-call support
Tune
Conduct a monthly review to reduce false positives
Backup & Recovery Monitoring
- RDS automated backups, plus an optional manual snapshot before major migrations
- S3 versioning and lifecycle rules for critical buckets
- Documented, annual restore testing (scoped)
- Alerts triggered on failed backup jobs or retention gaps
Disaster recovery planning pairs naturally with our AWS cloud services.
Monitoring + CI/CD
Deploy events are tagged in your logs and metrics. When your error rate spikes five minutes after a release, you'll know exactly where to look — see our CI/CD Pipeline Services.
Frequently
Asked Questions
Straight answers about our services, how we work, and how to get started with Teenva.
Custom software, AI solutions, and travel technology — built for teams that need more than templates.
CloudWatch covers most AWS-native stacks well. We add APM tooling like Datadog only when there's a clear need for distributed tracing.
Yes. We can add external uptime checks and log shipping for non-AWS hosts, scoped to your needs — though AWS-hosted stacks are where our tooling and runbooks are strongest.
Yes, as an optional retainer add-on. Default coverage is business-hours response with clear escalation paths; ask us about extended on-call options.
Your team, Teenva, or both. Alert routing — SNS, Slack, and email — is defined during onboarding so the right people get the right severity.
We tune thresholds, use composite alarms, and run a monthly review to cut noise. The goal is actionable alerts only — not alert fatigue.
Yes. We watch queue length, failed-job growth, and worker process health so backlog and silent failures surface as alarms.
Yes. We can scope monitoring to webhook failure rates, payment and messaging delivery errors, and related queues without a full infrastructure package.
Yes. We audit what you have, rebuild dashboards and alarms around critical paths, and attach runbooks so alerts lead to action.
Related Services
See Problems Before Your Customers Do
CloudWatch, uptime checks, logging, backups, and incident response — for travel, SaaS, and ecommerce platforms, delivered from Bangalore.
Discuss DevOps Monitoring
Ready to take your business to the next level?